Open 3D buildings, roofs included
Mapping agencies across Europe publish the true 3D shape of over 80 million buildings, free to use. Each does it in its own portal, format and coordinate system. Maphattan is a plan to gather them into one open dataset.
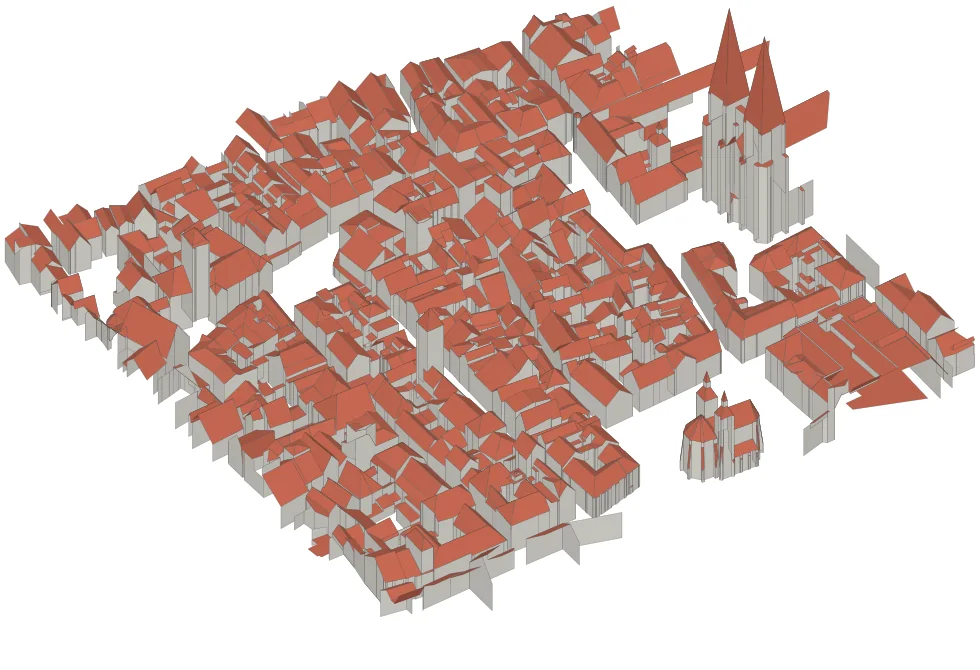
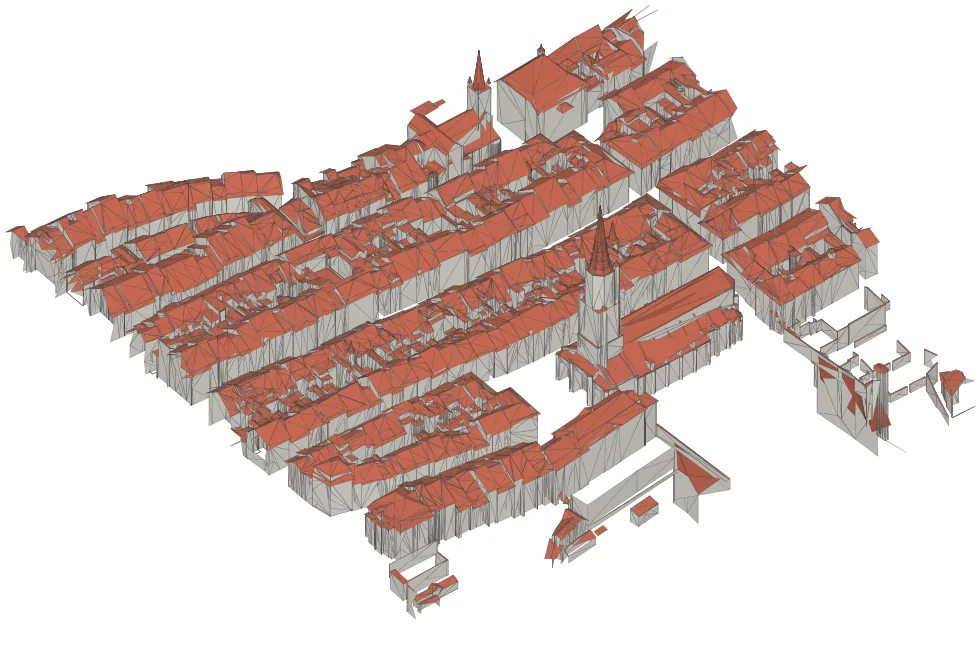
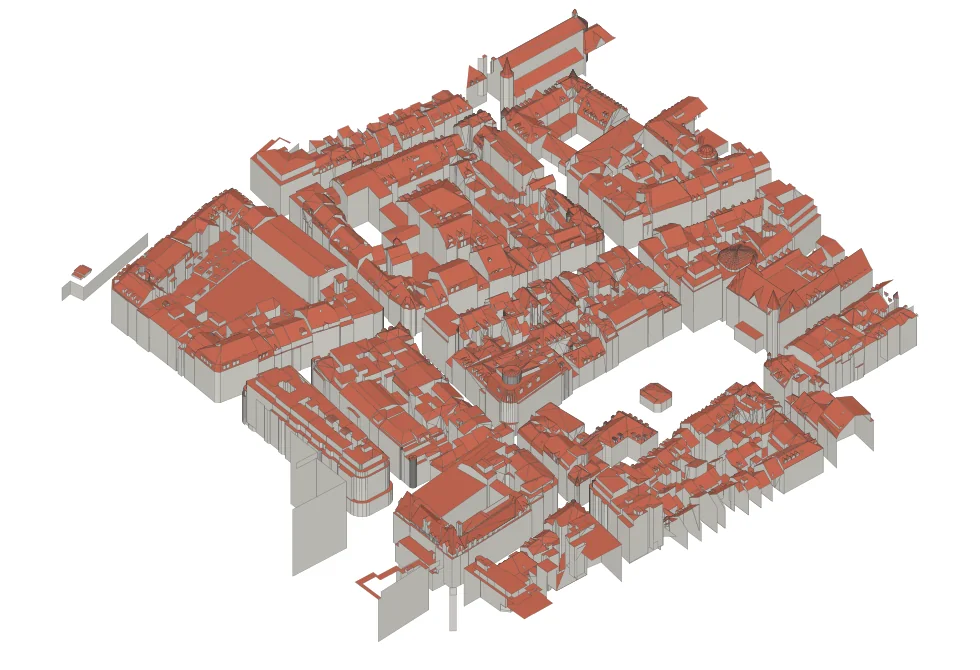
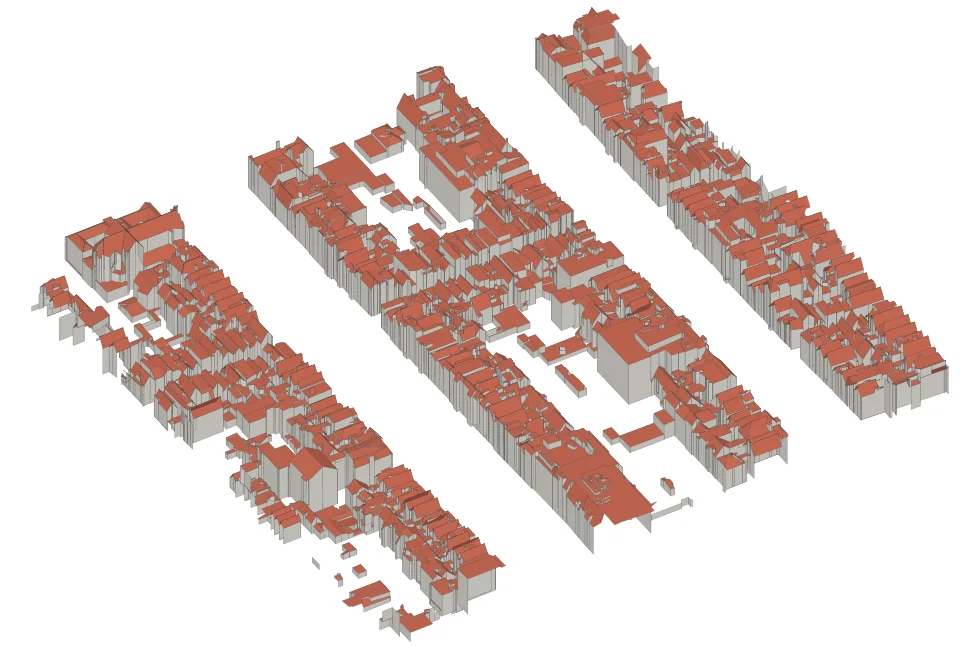
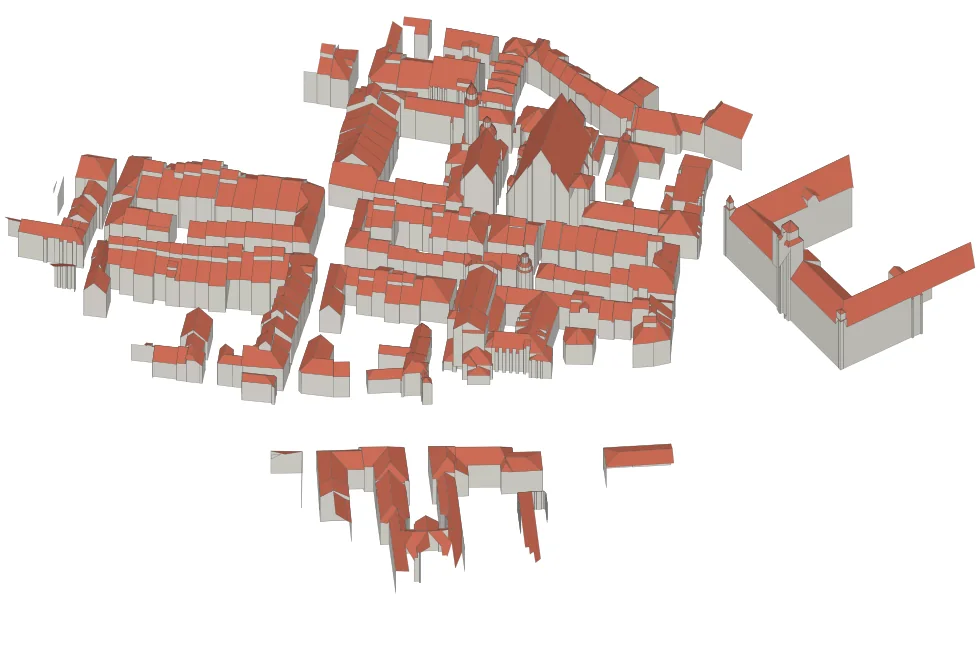
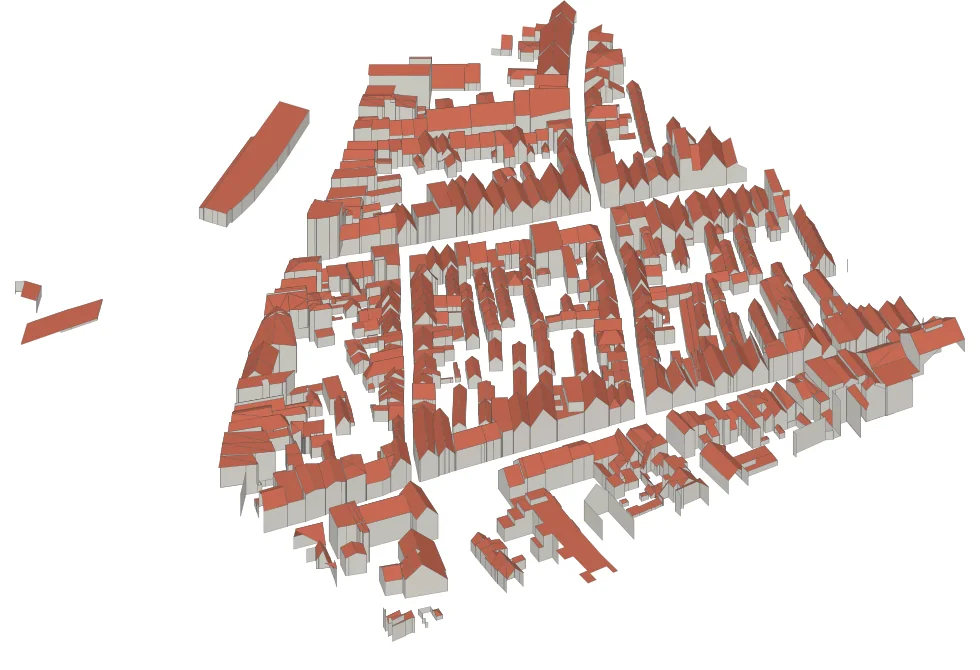
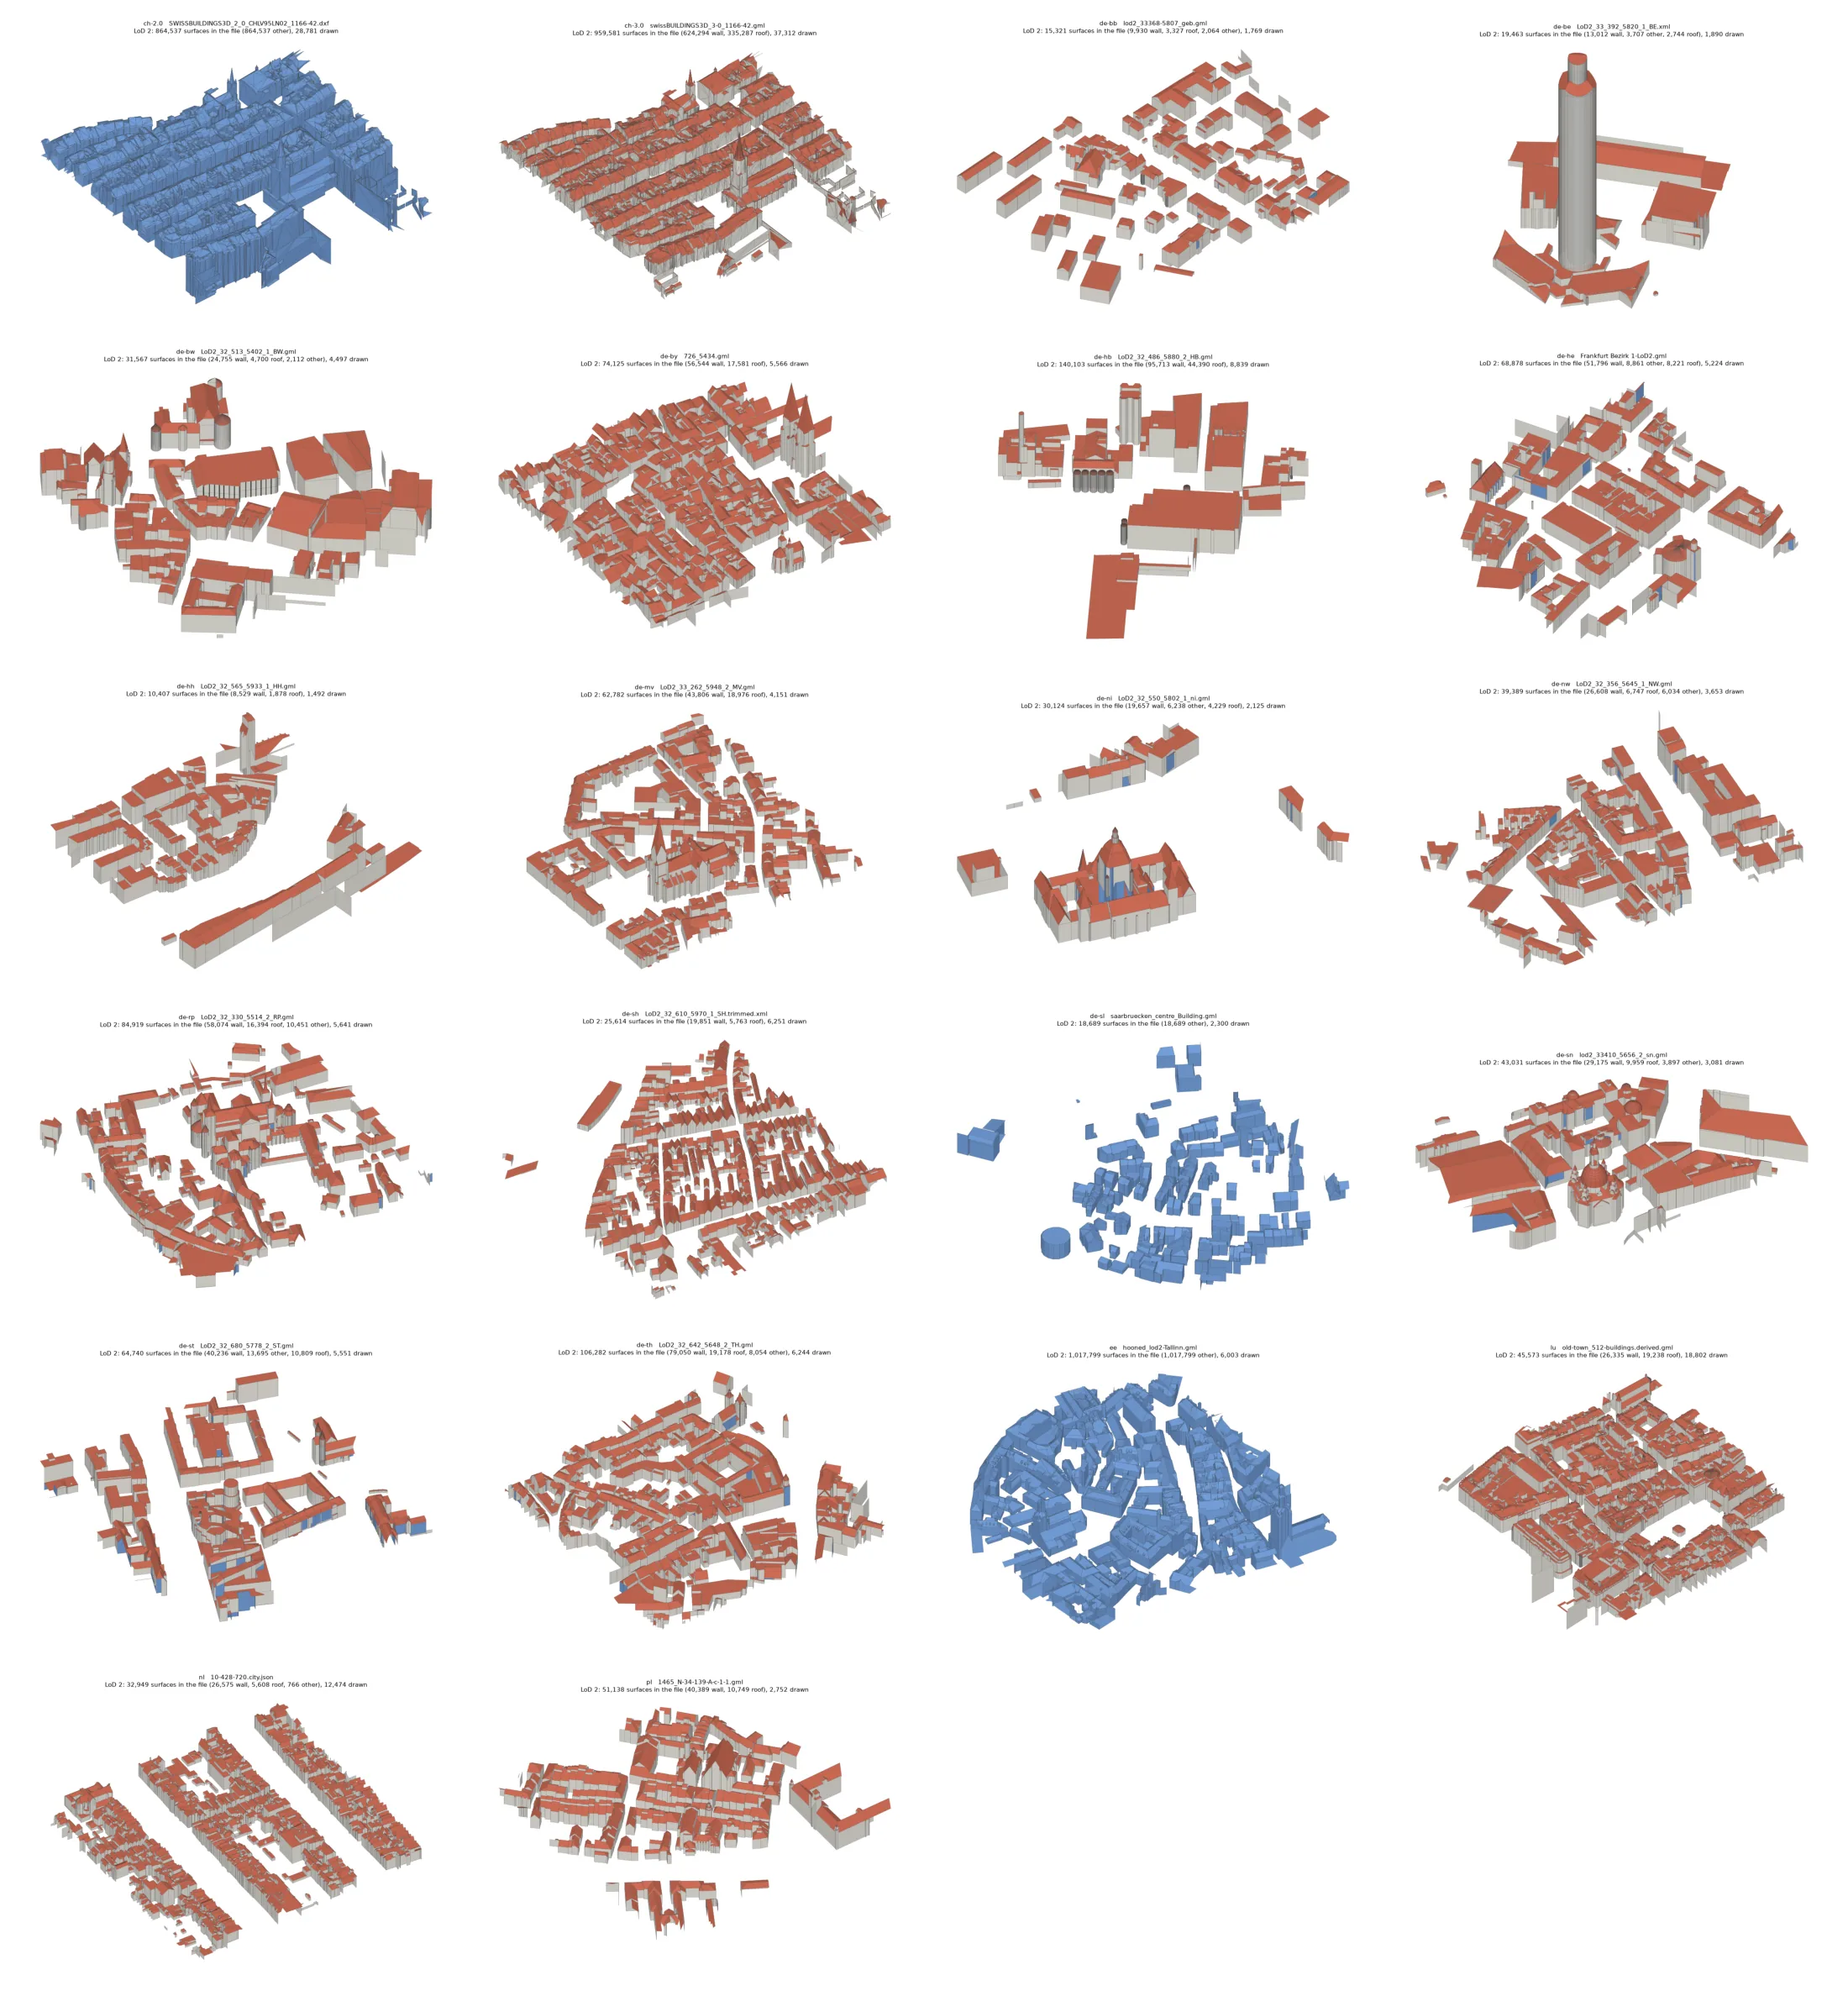
One downloaded tile from each of six sources, drawn the same way. Red surfaces are roofs, grey ones are walls.
- buildings with official 3D models
- 80 M+
- sources in 21 portals
- 22
- coordinate systems
- 8
- licences, all open
- 6
It is public
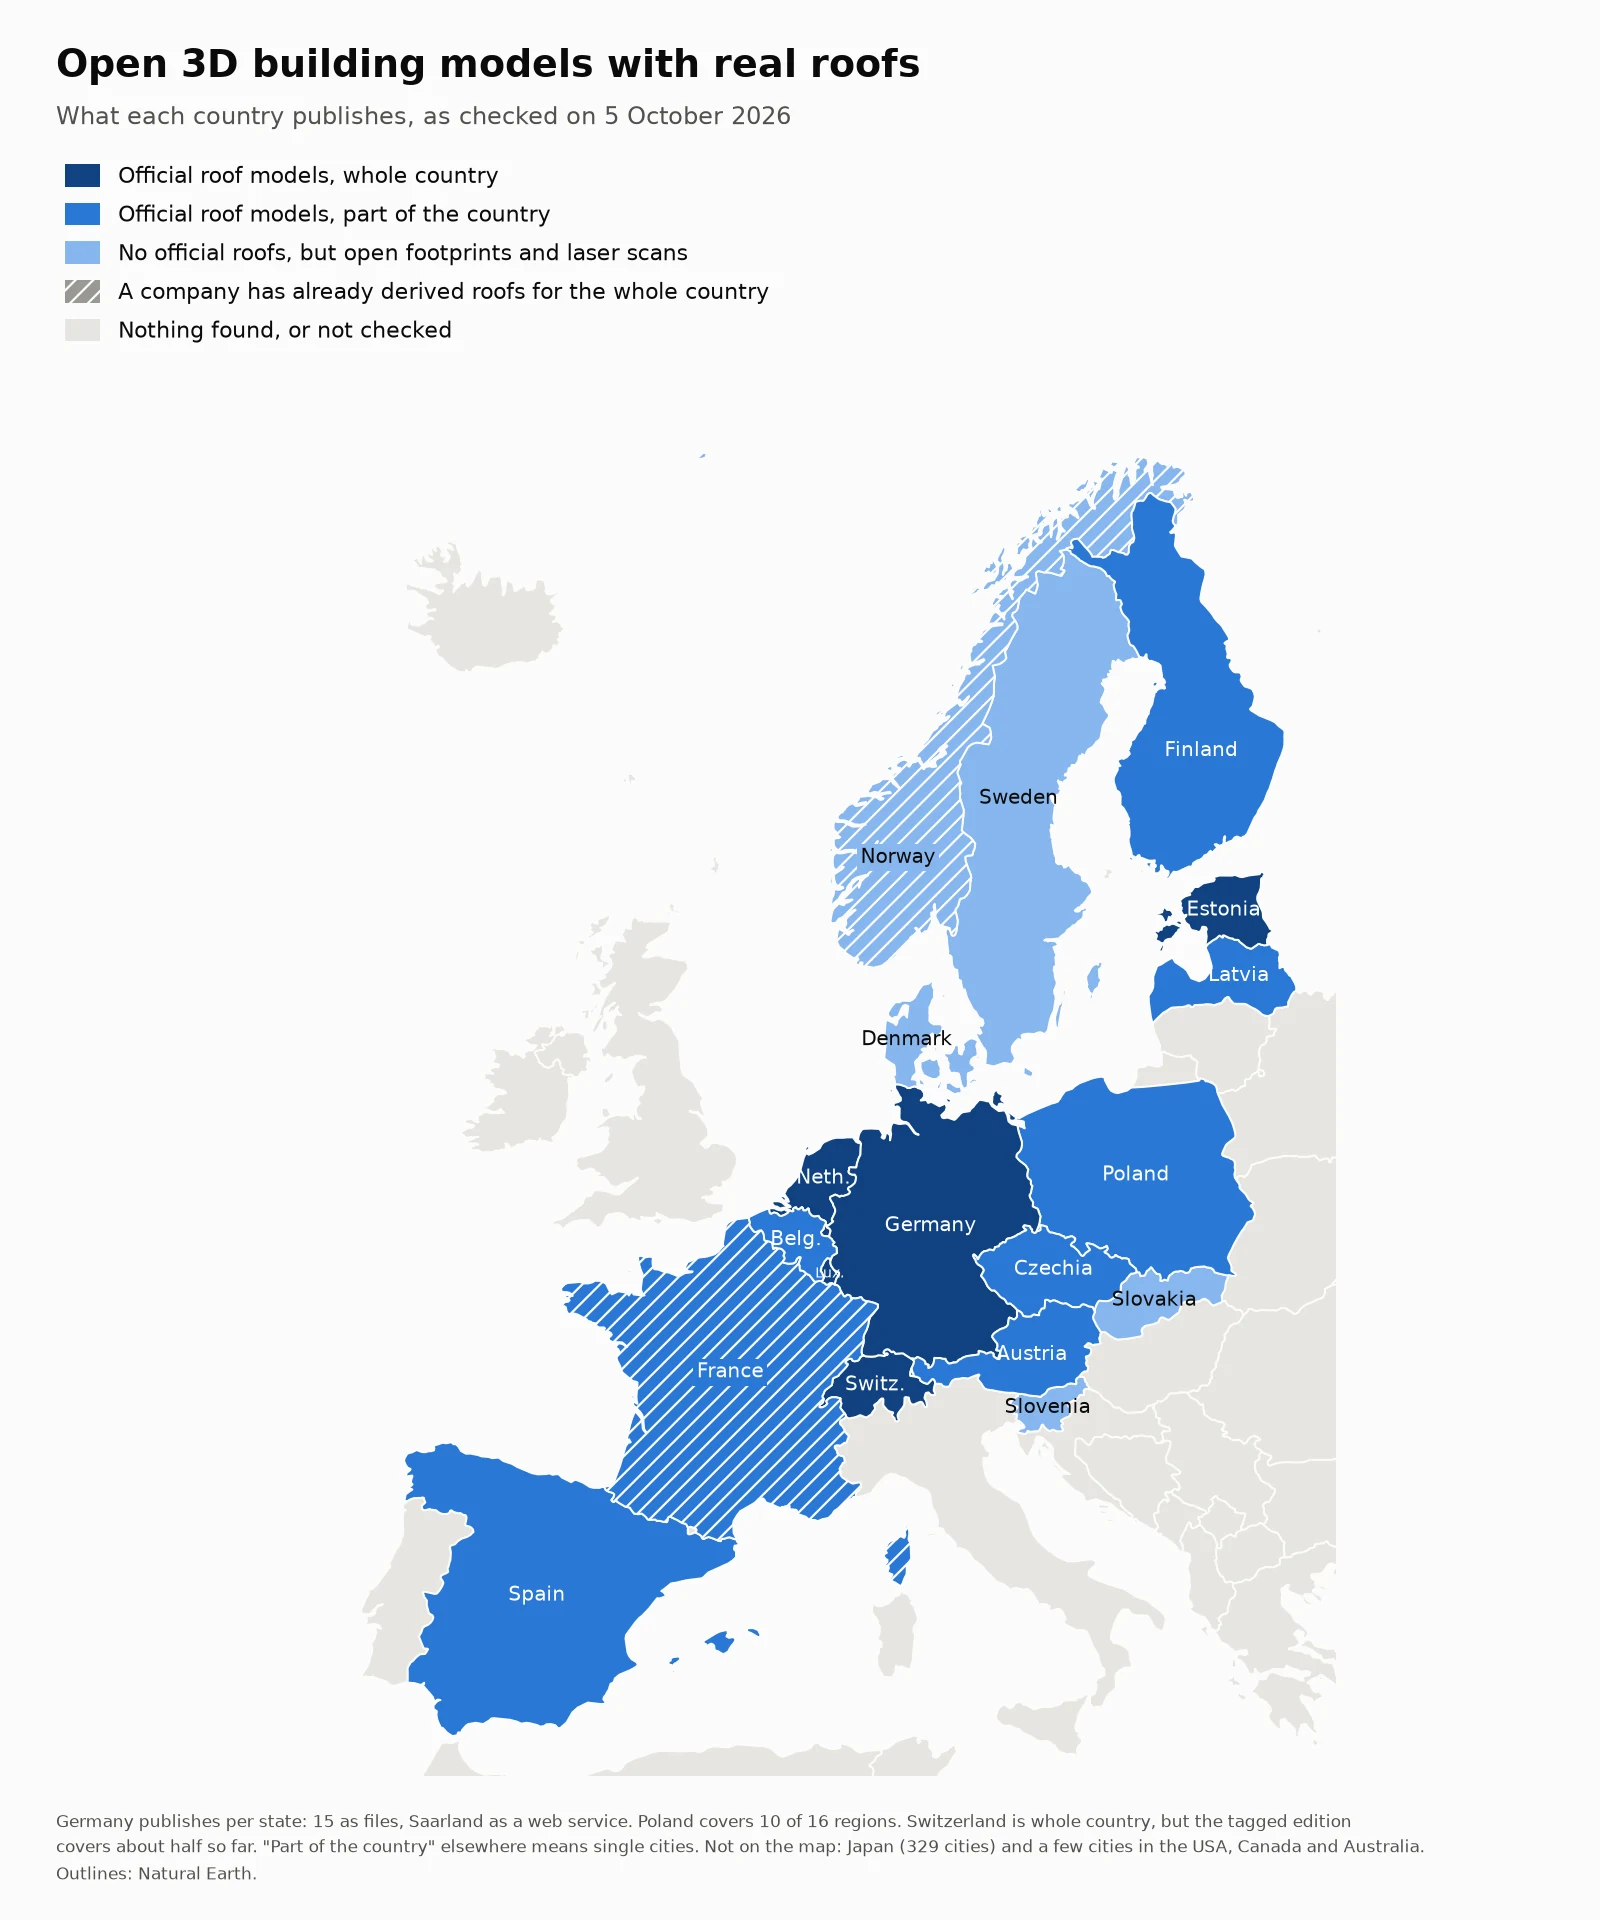
The Netherlands, Germany, Switzerland, Estonia and Luxembourg publish a 3D model of every building, and Poland of most of the country. Each model is a closed shape with its ground, walls and real roof planes.
It is scattered
Germany alone publishes through sixteen state portals. Every source lists its files in its own way, from Atom feeds and catalogues to a share hidden behind a map.
It does not fit together
The files use four formats, eight coordinate systems and two axis orders. Some label roofs and walls and some do not, and the attribute names differ from source to source.
Coverage
Germany is the largest part, with all sixteen states published. Elsewhere the official models often cover single cities, and in some countries only the laser scans are open, so the roofs have yet to be built from them.
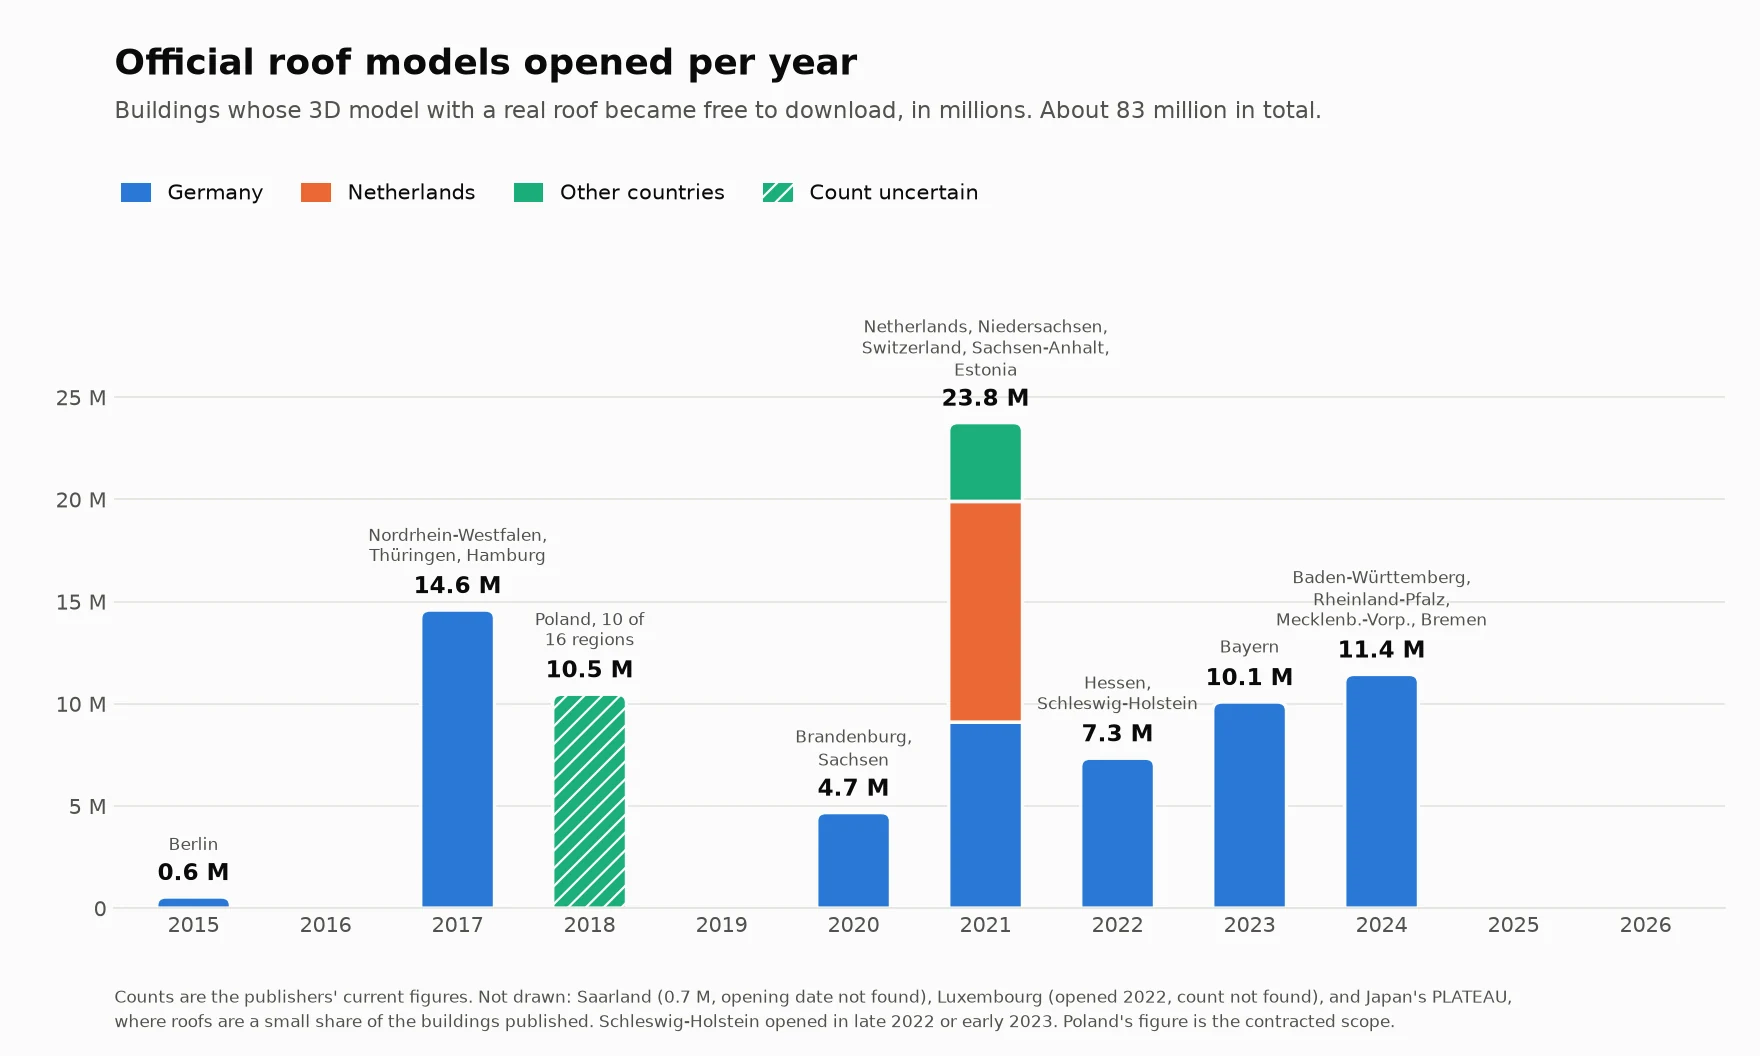
Most of the data opened in three bursts, the last in June 2024, when four German states opened within a week. Sweden, Czechia, Slovenia and Finland are producing their own models.
Every source, checked
In October 2026 I downloaded one real tile from every source and read the files. All of them download without an account. The table lists what each one is and what to watch for.
| Source | Buildings | Opened | Format | How the files are listed | Licence | What to watch for |
|---|---|---|---|---|---|---|
Netherlands 3DBAG (tudelft3d and 3DGI) | 10.8 M | 2021 | CityJSON 2.0 | Tile index service | CC BY 4.0 | Most buildings in a city tile fail the publisher's strict geometry check, yet draw fine. |
Poland GUGiK | about 10 M | 2018 | CityGML 2.0 | One file per county, behind a map | CC BY 4.0 | Covers 10 of 16 regions, from laser scans of 2012. |
Estonia Maa- ja Ruumiamet | 0.9 M | 2021 | CityGML 2.0 | One file per municipality | Estonian open data licence | Surfaces are not labelled as roof or wall, and northing comes first. |
Luxembourg Administration du cadastre et de la topographie | not stated | 2022 | CityGML 2.0 with photos | One file per commune | CC0 | The capital is one 5.4 GB zip, mostly photos, and northing comes first. |
Switzerland, older product swisstopo | about 3 M | 2021 | DXF | STAC catalogue | swisstopo open data terms | No building IDs and no roof or wall labels. |
Switzerland, newer product swisstopo | not stated | 2024 | CityGML 2.0 | STAC catalogue | swisstopo open data terms | Covers about half of the tiles so far, at 1.6 GB per tile unzipped. |
| Germany, published by each state | ||||||
Baden-Württemberg LGL | 6.5 M | 2024 | CityGML 1.0 | No index, names follow a grid | dl-de/by-2.0 | The zips break the macOS unzip tool. |
Bayern Bayerische Vermessungsverwaltung | 10.1 M | 2023 | CityGML 1.0 | Checksum list | CC BY 4.0 | The roof slope field holds 90 minus the slope. |
Berlin Senatsverwaltung für Stadtentwicklung | 0.6 M | 2015 | CityGML 1.0 | Atom feed | dl-de/zero-2.0 | How the roofs were made is not stated. |
Brandenburg LGB | 2.4 M | 2020 | CityGML 1.0 | Directory listing | dl-de/by-2.0 | A third of the buildings keep their shape only in their parts. |
Bremen Landesamt GeoInformation Bremen | 0.3 M | 2024 | CityGML 1.0 | One zip inside another | CC BY 4.0 | There is no tile list besides the zip's own directory. |
Hamburg LGV Hamburg | 0.4 M | 2017 | CityGML 1.0 | One zip | dl-de/by-2.0 | Older links in circulation lead to the 2016 edition. |
Hessen HVBG | 5.0 M | 2022 | CityGML 1.0 | The portal's own JSON API | dl-de/by-2.0 | Download links expire after a day. |
Mecklenburg-Vorpommern LAiV | 1.3 M | 2024 | CityGML 1.0 | Atom feed | CC BY 4.0 | The server ignores partial downloads. |
Niedersachsen LGLN | 7.3 M | 2021 | CityGML 1.0 | STAC catalogue | CC BY 4.0 | The old portal address no longer works. |
Nordrhein-Westfalen Geobasis NRW | 11.9 M | 2017 | CityGML 1.0 | XML index | dl-de/zero-2.0 | About 2,400 of the tiles are empty. |
Rheinland-Pfalz LVermGeo RLP | 3.3 M | 2024 | CityGML 1.0 | Directory and checksum list | dl-de/by-2.0 | Single tiles reach 200 MB. |
Saarland LVGL | 0.7 M | not found | INSPIRE GML | Web service only | dl-de/by-2.0 | No roof or wall labels, coordinates in degrees, and asking for the usual grid returns zeros. |
Sachsen GeoSN | 2.3 M | 2020 | CityGML 1.0 | A file share named in the map app | dl-de/by-2.0 | The official page is a map click, and its file links are dead. |
Sachsen-Anhalt LVermGeo ST | 1.8 M | 2021 | CityGML 1.0 | Four bulk zips | dl-de/by-2.0 | About 600 of the tiles are empty. |
Schleswig-Holstein LVermGeo SH | 2.3 M | 2022 | CityGML 1.0 | GeoJSON tile index | CC BY 4.0 | Every file has a web page appended after its end. |
Thüringen TLBG | 2.3 M | 2017 | CityGML 1.0 | Atom feed | CC BY 4.0 | The landing page sits behind a CAPTCHA. |
The plan
Maphattan will turn the scattered national files into one dataset that is easy to use.
- 1
Collect
An open fetcher for every source, which knows how that portal lists its files and notices when a new edition appears.
- 2
Harmonise
One coordinate system and one schema. Roofs and walls are labelled everywhere, the official building ID is kept, and each building says where it came from.
- 3
Publish
Free downloads per region in open formats, for 3D tools, for analysis and for web maps, with a catalogue of sources, dates and licences.
- 4
Keep current
Rebuild a region when its agency publishes a new edition, and add countries as they open their data.
The data keeps its original licences, and every download carries the credits its sources require. The code will be open source. Today there is this survey and a demo. The work above is what I am seeking funding for.
On a web map
The demo puts 3DBAG's models of central Amsterdam on a MapLibre map, next to the boxes that open web maps show today. MapLibre has no built-in way to draw a pitched roof yet, so the demo draws them with a custom layer.
Open the demo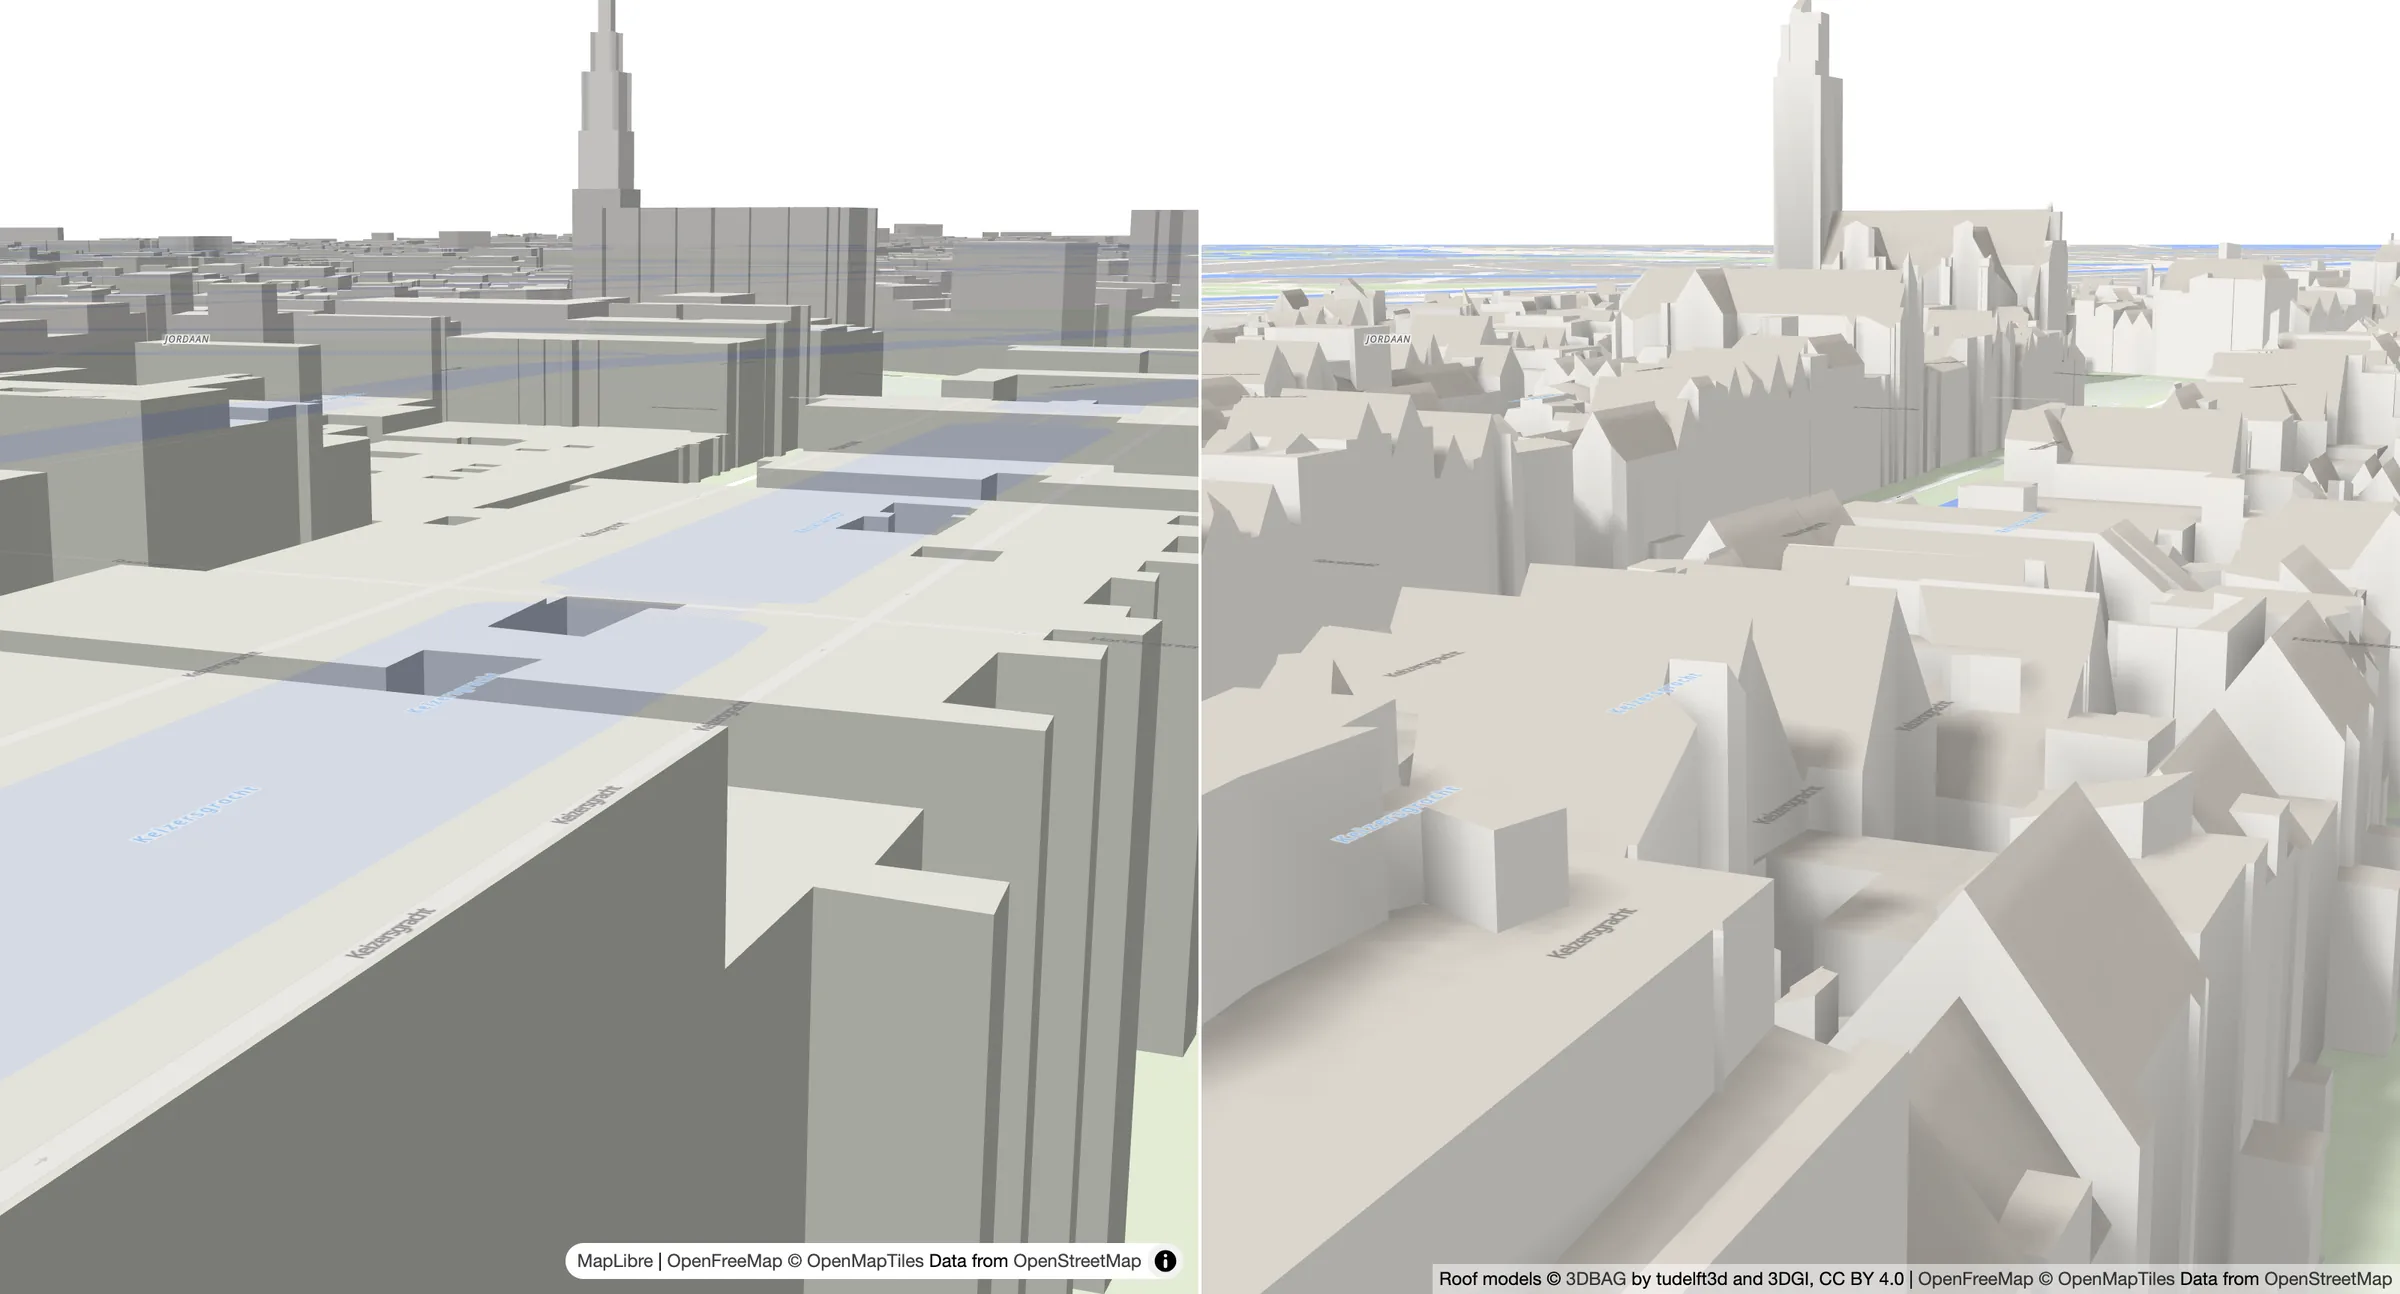
About
I'm Birk Skyum. I co-founded MapLibre, and I work on the rendering in MapLibre GL JS and the MapLibre integration in deck.gl.
Data credits
The drawings on this page contain data from the publishers below, under the licences in the table above. Demo buildings © 3DBAG by tudelft3d and 3DGI, CC BY 4.0. Basemap from OpenFreeMap, © OpenMapTiles, data from OpenStreetMap. Country outlines from Natural Earth.
- Netherlands, 3DBAG by tudelft3d and 3DGI
- Poland, GUGiK
- Estonia, Maa- ja Ruumiamet
- Luxembourg, ACT Luxembourg
- Switzerland, older product, © swisstopo
- Switzerland, newer product, © swisstopo
- Baden-Württemberg, © LGL, www.lgl-bw.de
- Bayern, Bayerische Vermessungsverwaltung, www.geodaten.bayern.de
- Berlin, Geoportal Berlin
- Brandenburg, GeoBasis-DE/LGB
- Bremen, © GeoBasis-DE / Landesamt GeoInformation Bremen
- Hamburg, Freie und Hansestadt Hamburg, LGV
- Hessen, HVBG
- Mecklenburg-Vorpommern, © GeoBasis-DE/M-V
- Niedersachsen, LGLN
- Nordrhein-Westfalen, Geobasis NRW
- Rheinland-Pfalz, © GeoBasis-DE / LVermGeoRP
- Saarland, LVGL Saarland
- Sachsen, GeoSN
- Sachsen-Anhalt, © GeoBasis-DE / LVermGeo ST
- Schleswig-Holstein, © GeoBasis-DE/LVermGeo SH
- Thüringen, © GDI-Th